
Efficiency Report
Analyses how efficiently work flows through the delivery pipeline — cycle time, lead time, and time-in-status distributions.
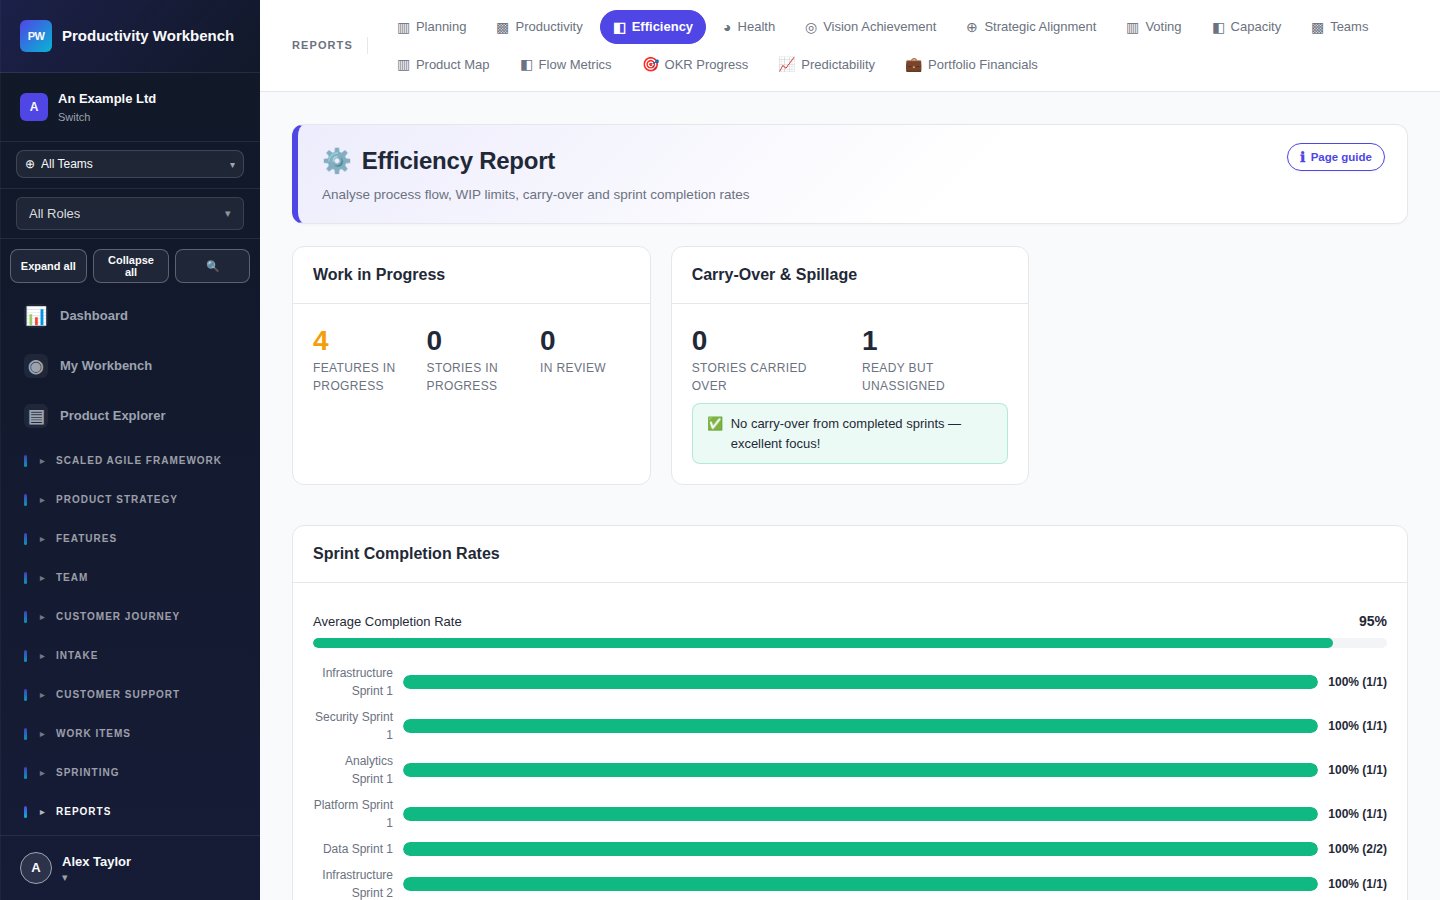
Key metrics
- Cycle time — Average time from "In Progress" to "Done" for Stories. Shorter = more efficient flow.
- Lead time — Average time from Story creation to Done. Includes queue time.
- Time-in-status distribution — How long Stories spend in each status on average. Long "In Review" times indicate review bottlenecks.
- WIP age — Distribution of how long current In Progress Stories have been open. Old WIP = delivery risk.
- Blocked time — Total hours/days Stories spent in Blocked status per sprint.
Tips
- Target cycle time reduction as a leading indicator — it predicts future throughput improvements.
- High WIP age often means Stories are too large. Check average story size alongside cycle time.