Documentation
Plan

53 of 187 pages

Page Guides

Reports Overview

Productivity Workbench includes reporting for delivery health, strategic alignment, and team performance. See the for a full description of each report.

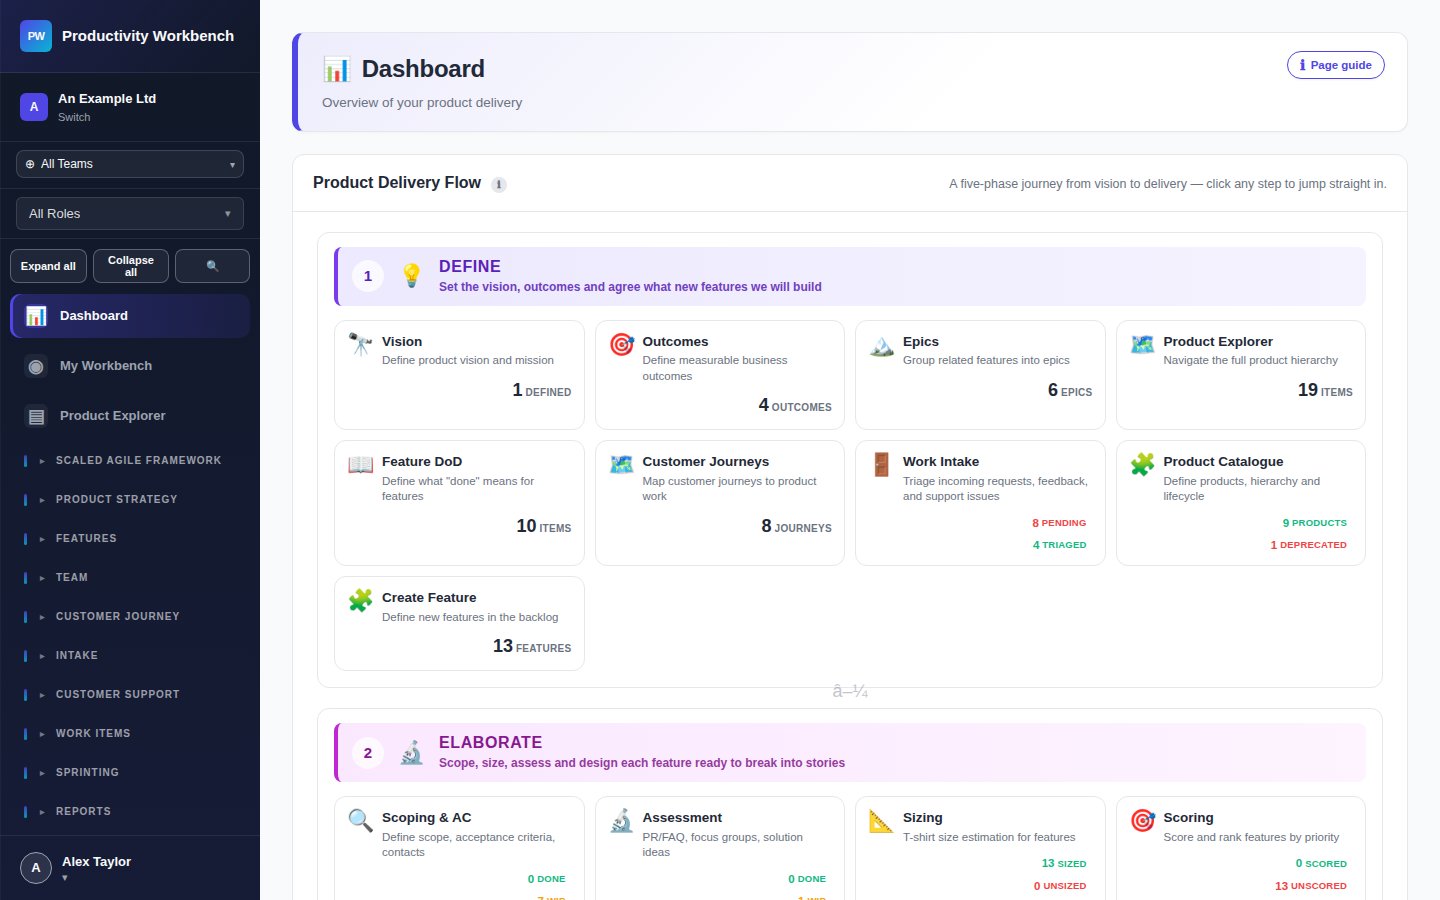
Screenshot: Reports navigation in the sidebar

Common controls (all reports)

Date range

Filter data to a specific time window. Most reports default to the last 3 months.

Team filter

Show data for all teams or a specific team. Business+

Export CSV

Download the report data as a CSV file for further analysis in a spreadsheet.

Print / PDF

Use the browser print function (Ctrl+P) — reports are styled for clean printing.

Report index

Planning Report
Sprint planned vs. committed vs. completed. Business+
Productivity Report
Story throughput, velocity trends, retro action completion.
Efficiency Report
Planned work vs. unplanned interruptions. Business+
Health Report
Sprint success rate, DoD compliance, rejection rate. Business+
Vision Achievement
Feature and Epic coverage against Outcomes. Business+
Strategic Alignment
Portfolio alignment score, strategy-to-story trace, per-feature scores, benefits realisation. Business+
Capacity Report
Team capacity vs. utilisation per sprint. Business+
Voting Report
Storypointing consensus and estimation accuracy.
Work Intake Report
Intake volume, acceptance rate, time-to-triage. Business+
User Journey Report
Feature coverage of journey touchpoints. Business+
Team Reports
Per-team delivery metrics and workload. Business+
Product Map Report
Feature coverage of the Product Catalogue. Business+
Flow Metrics
SAFe flow velocity, efficiency, load, distribution. Enterprise
OKR Dashboard
OKR progress at PI, ART, and team level. Enterprise
PPM Report
Programme Predictability Measure at PI close. Enterprise
System Demo Dashboard
Cumulative feature delivery through the PI. Enterprise
Portfolio Financial Report
Lean Budget spend vs. allocation by Value Stream. Enterprise

All Reports documentation

Build v0.3.2 · deployed 2026-10-19T23:52:31Z